Kronos AI is an open-source model for forecasting financial candlesticks. This Kronos AI setup guide takes you from installation to a local research test. The model takes a sequence of prices and trading activity and generates possible next candles. A forecast is only a research input: Kronos does not establish whether a trade is worth taking after costs.
Quick answer: Start with Kronos-mini, an isolated Python environment and a CSV containing invented candles. Confirm that the real model loads, run a held-out prediction, and compare its errors with an unchanged-price baseline. Then repeat the experiment on properly sourced historical data before considering any paper-trading integration. This walkthrough connects no broker and places no orders.
What to know first
The official Kronos project works with K-lines, another name for candlesticks. OHLCV means open, high, low, close and volume. A candle summarizes one interval; 400 hourly candles and 400 daily candles represent very different experiments.
Kronos is different from a chatbot reading company filings. If your question is why a business might perform well, use a source-checked stock research workflow. Kronos is more useful when your question is how to build and evaluate a numerical forecasting pipeline.
- Software: Git and Python 3.10 or later are documented prerequisites. The local walkthrough uses Windows and Python 3.12; activation commands differ on macOS and Linux.
- Compute: Start with CPU mode to verify the installation. GPU support depends on a compatible PyTorch installation and device. Parameter counts alone do not establish the RAM or VRAM your experiment needs.
- Costs: The repository has an MIT license. That does not make electricity, rented GPUs, market data or external services free. This local path needs model downloads, not a paid chatbot API key.
- Scope: Use a separate lab folder. Do not install this on the Techmixer hosting server or connect it to a funded account.
1. Create a separate Kronos AI lab
Open a terminal in a folder where you keep experiments. Clone the official project, record its revision, and create a virtual environment so the dependencies do not replace packages used by another application.
git clone https://github.com/shiyu-coder/Kronos.git
cd Kronos
git rev-parse HEAD
python -m venv .venv
On Windows PowerShell, the commands below use the environment’s Python directly. This avoids changing your PowerShell execution policy just to activate a script.
.\.venv\Scripts\python.exe --version
.\.venv\Scripts\python.exe -m pip install --upgrade pip
On macOS or Linux, use python3 -m venv .venv and .venv/bin/python in place of the Windows executable path. Keep the commit hash with your results: a future checkout may have different dependencies or interface behavior.
2. Install the forecasting library and web interface
Install both requirements files from the repository root. The core file covers the model stack; the web interface adds Flask and Plotly. Installing only the interface dependencies can leave the page accessible while model imports fail.
.\.venv\Scripts\python.exe -m pip install -r requirements.txt -r webui/requirements.txt
.\.venv\Scripts\python.exe -m pip check
.\.venv\Scripts\python.exe -c "from model import Kronos, KronosTokenizer, KronosPredictor; print('Kronos imports OK')"
Expected checks are No broken requirements found and Kronos imports OK. Stop here if either check fails. Read the first actual import or dependency error instead of treating a working webpage as evidence that inference is ready. The core requirements include pinned packages, so a clean environment is preferable to forcing them into an existing project.
For a CPU-only installation, you can first install the CPU build using the command selected on PyTorch’s official installation page, then install the two project requirements files. For CUDA, use the official selector for your operating system and supported runtime. Do not paste a CUDA-specific command into a Mac installation.
3. Start the dashboard on your own machine
Run Flask on loopback with debugging disabled. The repository’s convenience launchers enable development behavior; the explicit command below keeps the experiment reachable on your machine without exposing a development dashboard to your network.
.\.venv\Scripts\python.exe -m flask --app webui.app run --host 127.0.0.1 --port 7070 --no-debugger --no-reloadOpen http://127.0.0.1:7070. Select Kronos-mini and CPU, then choose Load Model. The first load downloads the weights and matching tokenizer. Wait for a successful loaded status before running a prediction.
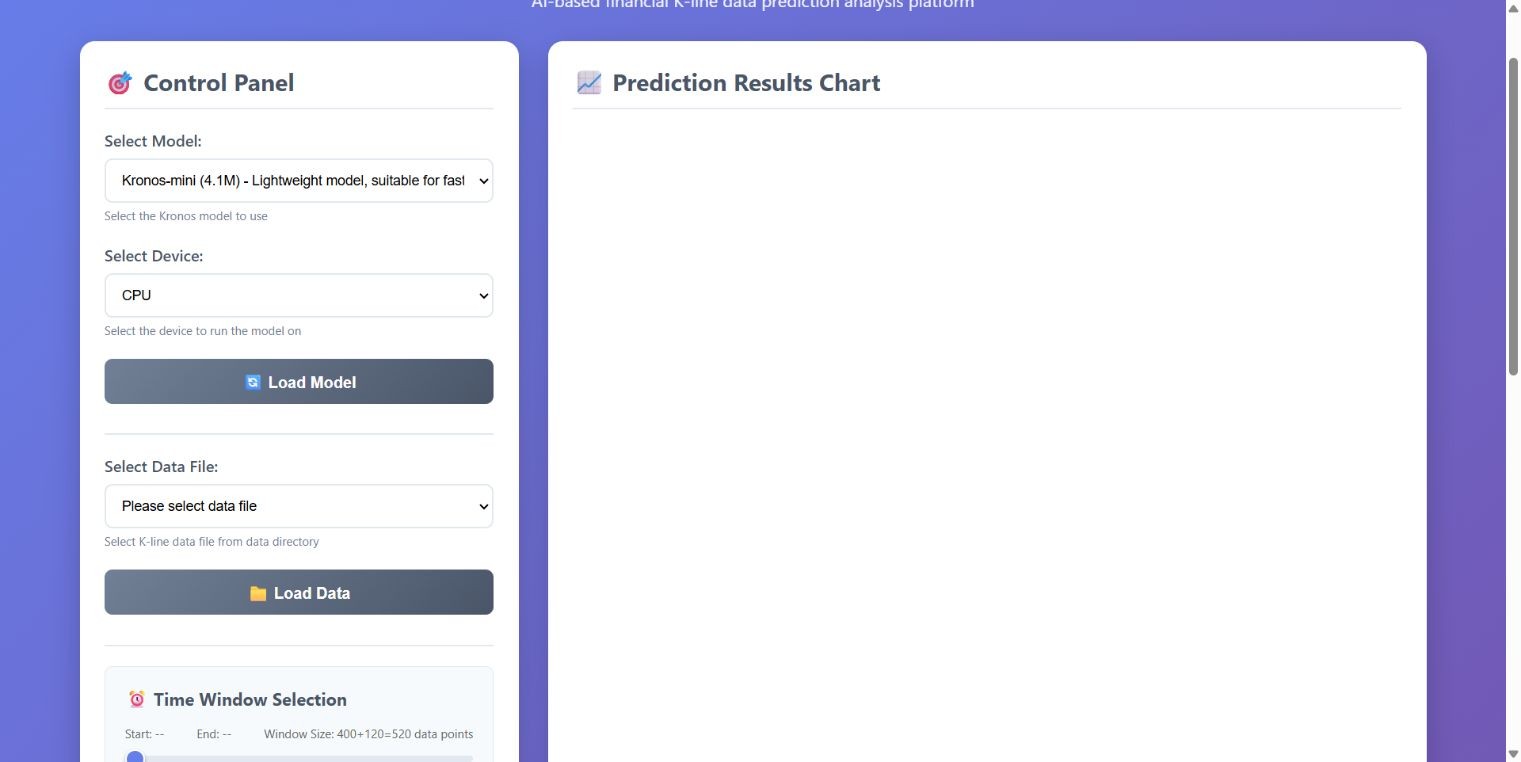
The current interface source contains an old startup message referring to simulated predictions, but its prediction route returns an error when the model is not loaded. If that warning appears, repair the import and check the loaded status. Do not describe an empty dashboard as a successful forecast.
Press Ctrl+C in the server terminal when finished. This is a local development interface, not a public forecasting service with authentication or production deployment safeguards.
4. Prepare candles without leaking the answer
Use a small synthetic file first so a data-subscription problem does not get confused with an installation problem. Save the following as make_demo.py in the repository root. These prices are invented; they cannot demonstrate investment performance.
from pathlib import Path
import numpy as np
import pandas as pd

# Invented candles for checking the software pipeline, NOT market history.
rng = np.random.default_rng(42)
n = 600
close = 100 + np.cumsum(rng.normal(0, 0.25, n))
opening = np.r_[close[0], close[:-1]]
df = pd.DataFrame({
    'timestamps': pd.date_range('2025-01-01', periods=n, freq='h'),
    'open': opening,
    'high': np.maximum(opening, close) + 0.15,
    'low': np.minimum(opening, close) - 0.15,
    'close': close,
    'volume': rng.integers(100, 1000, n),
})
Path('data').mkdir(exist_ok=True)
df.to_csv('data/synthetic_demo.csv', index=False)
print('Saved 600 synthetic hourly candles; not market history.')
.\.venv\Scripts\python.exe make_demo.pyReload the dashboard, select synthetic_demo.csv and click Load Data. Expect 600 rows. The interface’s fixed window uses 400 input candles and 120 comparison candles, so a tiny five-row example is not enough for this UI.
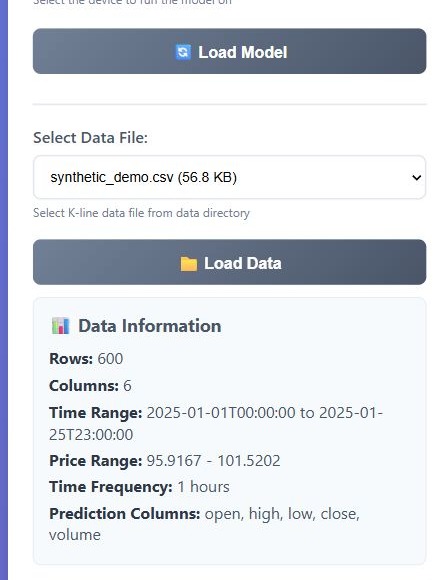
When replacing the sample with real data, check these conditions before inference:
- Use lowercase column names and real, ascending timestamps. Remove duplicate intervals and check the exchange timezone.
- Keep one consistent candle interval. Account for exchange sessions instead of creating nonexistent weekend stock candles.
- Validate that high is at least open and close, low is at most open and close, and required numbers are finite. Check negative prices or volume against the instrument’s actual conventions.
- Keep adjustments and units consistent. Mixing split-adjusted closes with unadjusted open/high/low can create false price jumps.
- Keep the held-out candle values out of model input. Future timestamps identify the forecast horizon; future prices are the answers you must withhold.
The dashboard can invent timestamps when they are absent and drop rows with missing values. That may make a file load, but it does not repair your market dataset. Inspect the timestamp range and row count yourself. For a historical experiment, also check whether the model’s pretraining could include the evaluation period; holding rows out of your script alone cannot rule out pretraining overlap.
5. Generate a forecast and inspect the result
Keep the initial settings unchanged: lookback 400, prediction length 120, temperature 1.0, top-p 0.9 and sample count 1. With the data and real model loaded, click Start Prediction. The chart compares generated candles with the withheld synthetic candles.
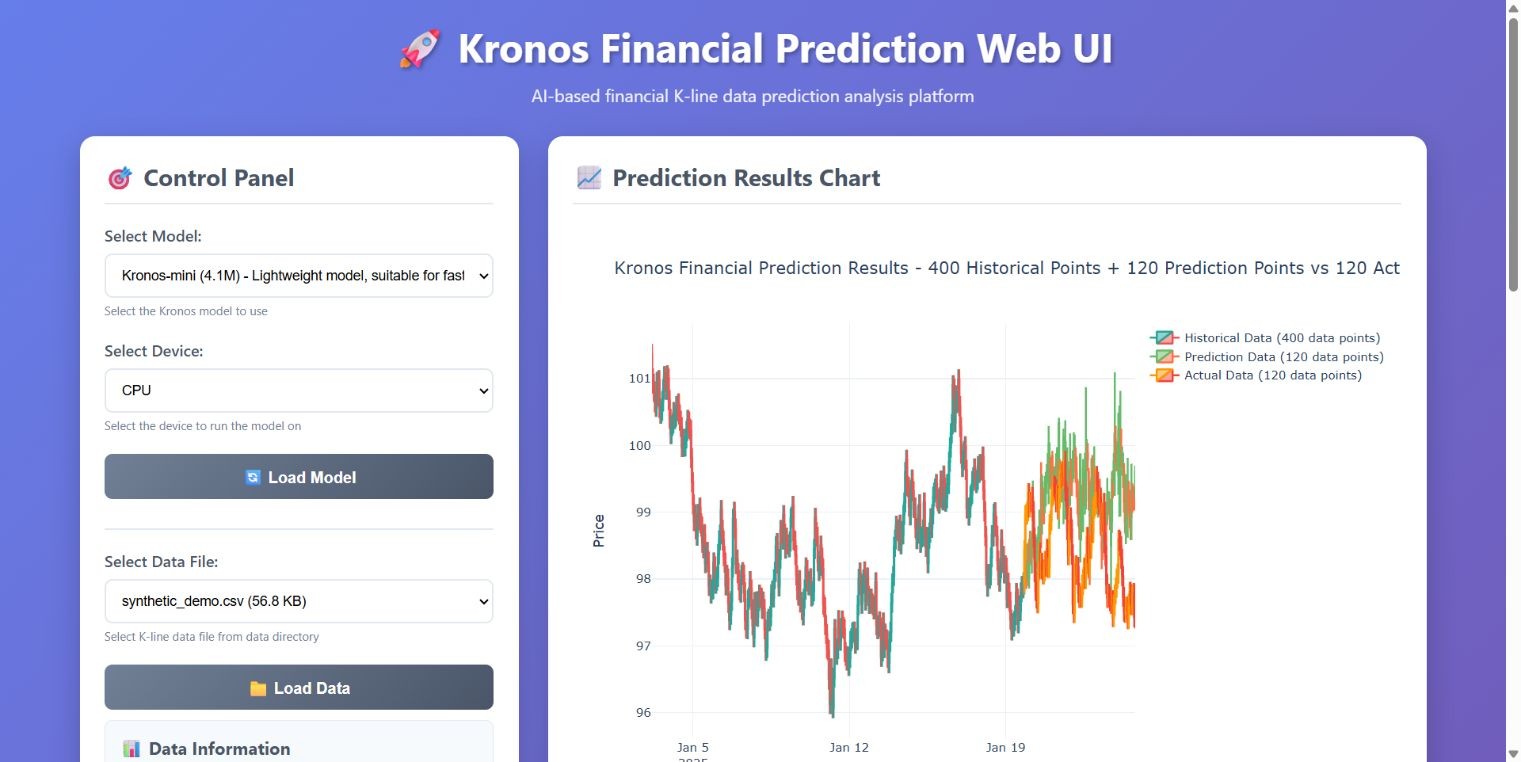
Check the Prediction Type and comparison period. In the inspected interface, the path labelled “latest data” still slices from the beginning of the file when no custom start is supplied. Verify the actual timestamps before assuming you forecast the most recent candles.
Use the interface for exploration. For a reproducible experiment, a Python script should set a random seed, identify the exact model and tokenizer, record sampling settings, and save the output. The predictor implementation returns forecast columns including prices, volume and amount. Multiple samples are averaged in the returned forecast; this is not automatically a calibrated confidence interval.
To check a shorter horizon programmatically, save this as check_forecast.py in the root. It uses the same synthetic file but holds out 12 candles so you can inspect the output before a longer experiment.
import json
import numpy as np
import pandas as pd
import torch
from model import Kronos, KronosTokenizer, KronosPredictor

torch.set_num_threads(2)
torch.manual_seed(42)
df = pd.read_csv('data/synthetic_demo.csv', parse_dates=['timestamps'])
cols = ['open', 'high', 'low', 'close', 'volume']
assert len(df) >= 520
assert df['timestamps'].is_monotonic_increasing
assert not df['timestamps'].duplicated().any()
assert not df[cols].isna().any().any()
assert np.isfinite(df[cols].to_numpy()).all()
assert (df['high'] >= df[['open', 'close']].max(axis=1)).all()
assert (df['low'] <= df[['open', 'close']].min(axis=1)).all()

tokenizer = KronosTokenizer.from_pretrained('NeoQuasar/Kronos-Tokenizer-2k')
model = Kronos.from_pretrained('NeoQuasar/Kronos-mini')
tokenizer.eval()
model.eval()
predictor = KronosPredictor(model, tokenizer, device='cpu', max_context=2048)
lookback, horizon = 400, 12
future = df.iloc[lookback:lookback+horizon]
pred = predictor.predict(
    df=df.iloc[:lookback][cols],
    x_timestamp=df.iloc[:lookback]['timestamps'],
    y_timestamp=future['timestamps'],
    pred_len=horizon, T=1.0, top_p=0.9, sample_count=1,
)
pred.to_csv('forecast_demo.csv')
actual = future['close'].to_numpy()
forecast = pred['close'].to_numpy()
baseline = df.iloc[lookback-1]['close']
result = {'input_rows':lookback, 'held_out_rows':horizon,
          'returned_rows':len(pred), 'finite':bool(np.isfinite(pred.to_numpy()).all()),
          'model_mae':float(abs(actual-forecast).mean()),
          'persistence_mae':float(abs(actual-baseline).mean()),
          'data':'invented synthetic candles; verifies execution only',
          'device':'cpu','torch':torch.__version__}
open('demo_result.json','w').write(json.dumps(result,indent=2))
print(json.dumps(result,indent=2))
.\.venv\Scripts\python.exe check_forecast.pyThe script writes forecast_demo.csv and demo_result.json. Expect 12 output rows. Successful execution proves that this environment can run the pipeline; it does not establish accuracy on stocks, crypto or unseen market regimes.
6. Compare with a baseline before trusting the chart
A plausible chart is a weak test. Compare the model with persistence: predict that every held-out close equals the last observed close. The example script calculates mean absolute error (MAE), which is the average absolute gap between predicted and actual closing prices.
For a simple worked example, suppose the last close is 100 and the next actual closes are 101, 99 and 102. Persistence predicts 100 each time, giving errors of 1, 1 and 2, or MAE 1.33. A model that scores 1.60 on that same window has not beaten this baseline, even if its chart looks sophisticated.
Our local pipeline check: the included seeded script returned 12 forecast rows using Kronos-mini on CPU. On these invented candles, model close-price MAE was about 0.656, versus 0.347 for persistence. Lower is better, so the model lost this particular comparison. This is an installation example on synthetic inputs, not evidence about real-market performance. Sampling and software changes can alter the values.
Repeat evaluation across several chronological windows, different regimes and an untouched final test period. Choose settings before looking at the final results. Report failures as well as successes; selecting only attractive screenshots turns an experiment into a sales pitch.
Price error is also different from trading profitability. A strategy evaluation needs explicit signals, position sizing, fees, spreads, slippage and drawdown measurements. None of those appear simply because a candle forecast was generated. The authors’ research paper provides research context, not a return guarantee for your dataset.
7. Keep the next stage in research or paper trading
If the workflow passes your data and evaluation checks, export a research record containing the input cutoff, horizon, model revision, settings, predicted values and later observed outcome. Review it independently before using it in any simulated decision process.
Keep forecasting separate from execution. Kronos does not supply a broker account, reliable order routing, exposure limits or a complete trading system. Our Claude Code and Alpaca paper-trading guide covers a different layer of that workflow. The Freqtrade and FreqAI research guide is another route for readers studying strategy evaluation. Neither integration is configured or tested by this Kronos walkthrough.
Do not move to a funded account because one run beat persistence. Stop and review the dataset if timestamps look wrong, output rows are missing, forecast numbers are non-finite or results change drastically after a small input shift.
Common setup problems
- “Kronos model library not available”: use the same virtual-environment executable for installation and startup, install both requirements files, and repeat the import check.
- No CSV appears: put it in the root
datadirectory and reload. A file elsewhere is not automatically listed. - Insufficient data: the dashboard needs its full comparison window. Shorter Python experiments can use a smaller horizon if enough held-out timestamps exist.
- Model download fails: check access to the official Hugging Face model and tokenizer pages, available storage and the first download error. Do not bypass certificate verification.
- CUDA or MPS fails: return to CPU for installation diagnosis. Then inspect your PyTorch/device compatibility separately.
- Port 7070 is occupied: select an unused local port and open that exact address. Do not stop an unrelated service just to reuse the example port.
Questions before you go further
Is Kronos a complete AI trading bot?
No. Kronos forecasts candle sequences. A usable trading workflow also needs separately evaluated signals, execution rules, risk controls and realistic transaction costs. This guide runs a local research experiment and connects no broker.
Does Kronos require an LLM API subscription?
The local Kronos workflow in this guide loads model and tokenizer files and runs inference on your computer. It does not require a paid chatbot API key. Hardware, electricity, optional hosted compute and market data remain separate costs.
Can synthetic data prove Kronos is profitable?
No. Invented candles can verify parsing, model loading, inference and output files. They cannot establish forecasting quality or a trading advantage on real financial markets. Use independently sourced data and chronological evaluation for that next stage.
Related Techmixer guides
- AI Tools: practical guides and workflows
- AI finance tools for research: costs and risks
- TradingAgents setup for source-based stock research
Our take
Kronos earns a place in a research lab when you want to understand candle forecasting and evaluate it systematically. Start small, keep an unchanged-price baseline beside every result, and spend more effort on data integrity than on making the chart persuasive. If your actual task is researching company fundamentals or operating a paper broker, use the appropriate workflow rather than expecting a forecast model to do everything.
Method and limits: Techmixer installed the core library and Flask interface in an isolated Windows/Python 3.12 environment, passed dependency/import checks and ran Kronos-mini CPU inference on invented candles. The 12-candle script check and the separate dashboard comparison are software checks, not real-market backtests. Screenshots show the actual local interface. Source code and official documentation were reviewed at commit 67b630e67f6a18c9e9be918d9b4337c960db1e9a. Synthetic inputs test the software path only. No live market feed, broker connection, funded account, real-money order, fine-tuning or profitability validation is included.
Last reviewed: 5 November 2026.