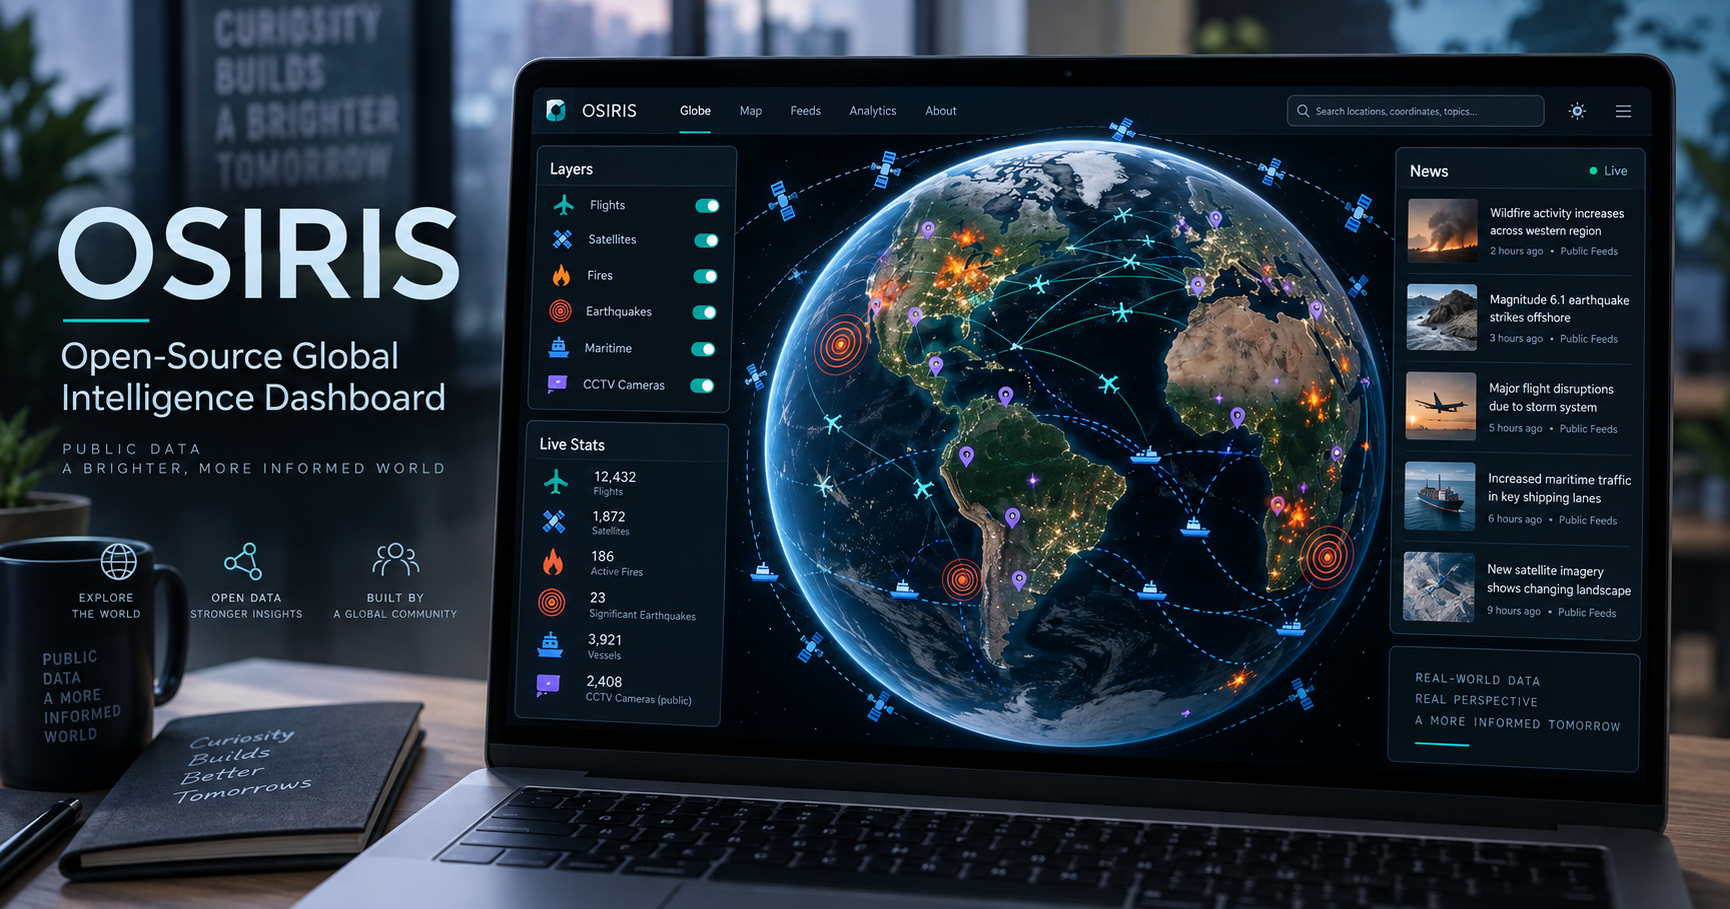
OSIRIS open-source intelligence dashboard is interesting because it makes public data feel like a live intelligence terminal: flights, CCTV-style camera sources, earthquakes, wildfires, maritime points, satellites, news, and other open feeds are presented in one browser-based interface. The important point is that OSIRIS is not classified magic; it is an open-source dashboard built around public data sources.
Quick answer
OSIRIS is an open-source global intelligence dashboard that uses public data feeds and a browser-based map interface to help users explore real-world events. It looks like a classified terminal, but the value is more practical: it brings many public feeds into one place so researchers, creators, builders, and curious users can explore flights, fires, earthquakes, CCTV sources, news, and more with context.
Best choice by use case
- Best for builders: studying how a Next.js and MapLibre dashboard can combine many public feeds.
- Best for OSINT learners: exploring how public sources can be layered on a map.
- Best for local awareness: checking nearby fires, earthquakes, transport cameras, or news context when the relevant layer is available.
- Not ideal for: emergency decisions, legal conclusions, or anything that requires verified official reporting without checking the source.
What to know first
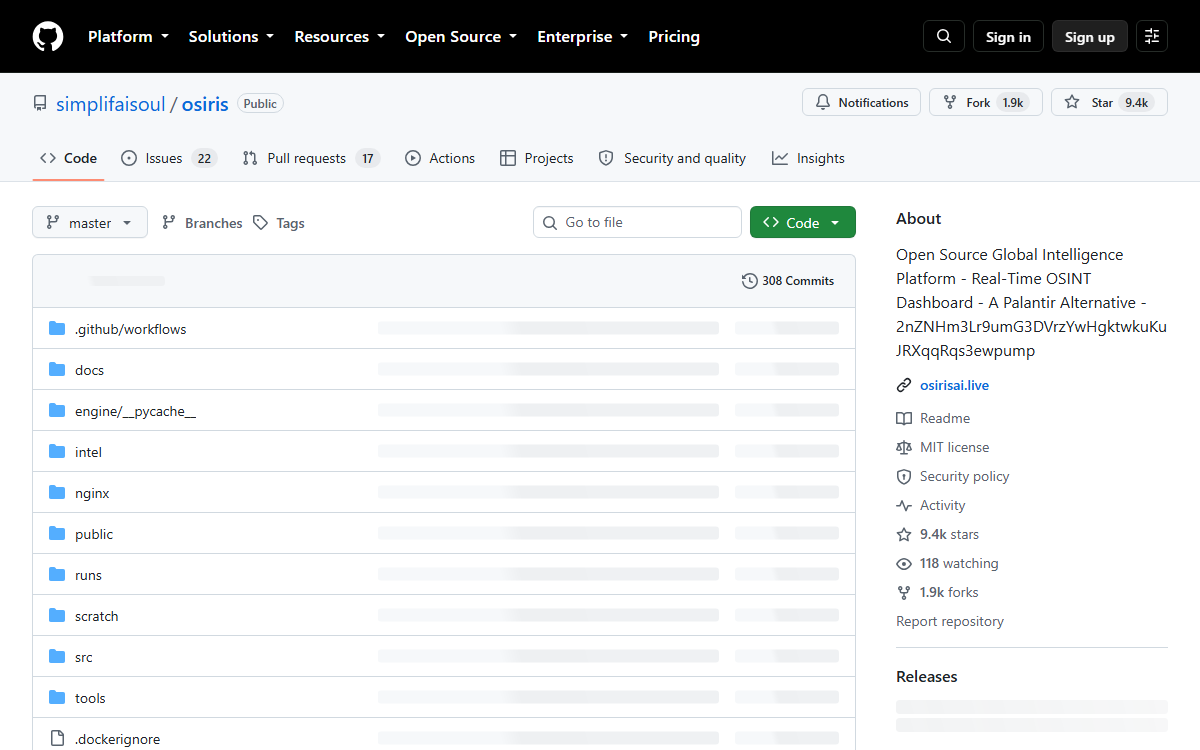
OSIRIS stands for Open Source Intelligence and Reconnaissance Integrated System. The official GitHub README describes it as a real-time global intelligence dashboard built with Next.js and MapLibre GL, with data rendered through a WebGL map interface.
The project lists public-source layers including OpenSky for aviation, USGS for earthquakes, NASA FIRMS and EONET for fire and event data, NOAA for space weather, NVD for vulnerability data, and other public or static sources. That is why the interface can look dramatic without needing a secret backend.
OSIRIS at a glance
| Tool | Best for | AI/workflow strength | Learning curve | Pricing note | Human review risk |
|---|---|---|---|---|---|
| OSIRIS | Open-source public-data situational awareness and OSINT learning | Strong for combining map layers, public feeds, and local filtering into one workflow | Medium | Open-source project; hosting, APIs, and public-source limits may still matter | Data freshness, coverage, source reliability, and legal/privacy context must be checked by a human |
7 things to know about OSIRIS
1. It is open-source, not classified software
The viral appeal comes from the interface: a live globe, map layers, aircraft, satellites, cameras, events, and news. But the project is public on GitHub and describes its sources openly, which makes it more useful for learning and experimentation than mystery.
2. It brings public feeds into one dashboard
The key idea is aggregation. Instead of visiting several separate websites for flights, earthquakes, fires, weather events, cameras, vulnerabilities, or news, OSIRIS tries to bring those feeds into one interface where users can filter, zoom, and explore context.
3. OpenSky is used for aviation tracking
The README lists OpenSky Network as the aviation source. That makes the flight layer dependent on public ADS-B style coverage and the limits of the source, not an all-seeing radar system.
4. Fire and earthquake layers need source awareness
Fire and earthquake data can be useful for situational awareness, but users should check timestamps and original sources. A hotspot, event marker, or public feed result is not the same as a local emergency instruction.
5. CCTV and camera layers can vary by region
The repository mentions many transport and camera sources, but availability can vary by agency, region, refresh rate, and outage. Some sources are snapshots, not real-time video streams.
6. The stack is useful for developers
For builders, the interesting part is the architecture: Next.js API routes, external data sources, MapLibre GL, progressive loading, and WebGL map rendering. It is a practical example of how to combine public feeds in one visual tool.
7. It still needs human verification
A dashboard can help you see patterns faster, but it cannot decide whether a source is complete, current, legal to use, or appropriate for a serious decision. Treat OSIRIS as a public-data exploration tool and verify important findings at the source.
Practical workflow
- Pick one question first: for example, “Are there fires near this city?” or “What flights are visible over this region?”
- Enable only relevant layers: too many feeds can create visual noise.
- Zoom to the location: use the map to narrow the area before interpreting markers.
- Check the source: follow the official feed or API source when the result matters.
- Note timestamps: public feeds can lag, fail, or cover only specific regions.
- Do not treat it as emergency guidance: use official local alerts for safety decisions.
What the public feeds mean
Public feeds are powerful, but they are not complete by default. Flight tracking can miss aircraft depending on coverage and sharing rules. Camera networks can be delayed, offline, or limited to transportation snapshots. Fire and weather event feeds can show satellite detections or reported events, not necessarily a ground-confirmed local condition.
That is why OSIRIS is best used as a starting point for awareness. If a marker matters, open the original source, check the timestamp, compare with another official source, and avoid making claims from the dashboard alone.
What to verify before acting
- Source: which public feed produced the marker or event?
- Timestamp: when was the data last refreshed?
- Coverage: does the source cover this region reliably?
- Meaning: is the marker a live event, a static reference point, or a delayed snapshot?
- Authority: does an official local agency confirm the same situation?
Safe use cases
Good use cases include learning OSINT workflows, comparing public data sources, building a demo dashboard, monitoring broad regional patterns, or teaching how open feeds can be combined. Riskier use cases include emergency response, tracking individuals, drawing legal conclusions, or publishing claims without checking the original source.
For Techmixer readers, the most useful lesson is the build pattern: a modern web app can connect public APIs, map layers, and news feeds into a single interface. That is valuable for developers and analysts, but the final interpretation still belongs to the human user.
Official and source links
- OSIRIS GitHub repository
- OSIRIS live demo
- OpenSky Network
- USGS Earthquake Hazards Program
- NASA FIRMS
- NASA EONET
- MapLibre
Related Techmixer guides
- Software Guides
- Online Tools
- Best Tools
- AI Tools
- Best No-Code AI Workflow Automation Tools for Small Teams
- Top AI Productivity Tools for Business and Entrepreneurs
FAQ
What is OSIRIS?
OSIRIS is an open-source intelligence and reconnaissance dashboard that combines public data feeds into a browser-based situational-awareness interface.
Is OSIRIS using secret data?
No. The project describes public and open feeds such as OpenSky, USGS, NASA, NOAA, NVD, and public camera or news sources, not classified data.
Does OSIRIS run in the browser?
The project is built with Next.js and MapLibre GL, with a browser-based map interface and API routes that connect to external public data sources.
Who should use OSIRIS carefully?
Anyone using OSIRIS for decisions should verify the original source, timestamp, coverage limits, and legal/privacy constraints before acting on the data.
Our take
OSIRIS is useful because it makes public data feel explorable. The best way to understand it is not as a spy tool, but as a browser-based public-data dashboard that shows what is possible when open feeds are wired into one map. Techmixer would use it for learning, monitoring experiments, and OSINT workflow exploration, while verifying important details from original sources.
Last reviewed: 15 September 2026.