

To check VRAM usage by app on Windows, open gputaskman, select the GPU your application uses, and sort the process list by memory. That gives you a name to investigate when a game or local AI model runs short of graphics memory. On a laptop with integrated graphics, look at the shared RAM reading too. On our test machine, the dedicated-memory line alone would have missed almost 2 GB in use.
What the GPU monitor showed on our Windows laptop
We installed gputaskman 0.4.4 in an isolated Python environment and ran gputaskman --once. On an Intel Arc 140V with driver 32.0.101.8831, the snapshot reported 0 MB of 128 MB dedicated memory, 1.99 GB of shared system RAM and 9% GPU activity. These are readings from one moment. They answer three different questions: how much dedicated memory is occupied, how much ordinary RAM the GPU is using, and how busy it is.
That distinction matters if you see “0 MB” and assume an app must be running entirely on the CPU. On this machine the shared-memory and activity readings gave us a reason to keep looking. We also got no temperature or power reading. An unavailable sensor tells you nothing about how hot the laptop is.
3 steps to check VRAM usage with gputaskman
- Choose the download for your processor. Open the official 0.4.4 release. The Windows x64 archive is for Intel and AMD PCs, including machines with NVIDIA graphics. Pick ARM64 for a Windows on Arm PC. If unsure, look under Settings ? System ? About ? System type. The portable build includes its runtime.
- Extract the whole ZIP. Keep the
_internalfolder besidegputaskman.exe. Open PowerShell in that directory and run.\gputaskman.exe --once. Look for your adapter name followed by memory readings. The project describes its portable builds as unsigned and publishes SHA-256 checksums alongside them. - Open the live view. Run
.\gputaskman.exein the same folder. Press s to cycle the sort order until the list is sorted by VRAM. If your goal is to find what is doing work right now, cycle to GPU percentage. An application can retain memory between bursts of activity.
Already using Python tools? With Python 3.11 or newer and pipx available, use pipx install gputaskman, then gputaskman --once. We tested the Python package. The portable ZIP instructions above follow the maintainer’s documentation.
Compare VRAM usage before and after closing an app
Suppose a local model refuses to load while a video editor is open. Save your editing work and leave the project open for a baseline. Note the adapter, the editor’s process name and VRAM usage, and the device total. If a model runner is already open, record its usage separately. Then close the editor normally, leave the other apps alone and take another reading on the same adapter.
If the editor disappears, device memory falls, and the same model now loads at the same settings, you have a practical workaround for that project. If the editor disappears but little memory returns, check which other process still holds a large allocation. If your laptop has two GPUs, confirm the editor and model were using the same one before comparing numbers. Avoid ending desktop or driver processes to chase the last few megabytes.
This is a diagnostic you can repeat, rather than a benchmark result from our Intel test. A single large allocation does not establish a memory leak. For that question, repeat the same open-and-close cycle and see whether memory keeps rising across runs.
Why a model download can understate VRAM usage
A model file holds weights. Running it can also require working buffers and a cache of information from earlier tokens, called the KV cache. A useful experiment is to load the same model twice with different context limits, fully unloading it between runs. Keep the model file, GPU and other applications the same. Record the process memory after each load. If VRAM usage rises with the longer context, shorten the context and retry before switching to a smaller model.
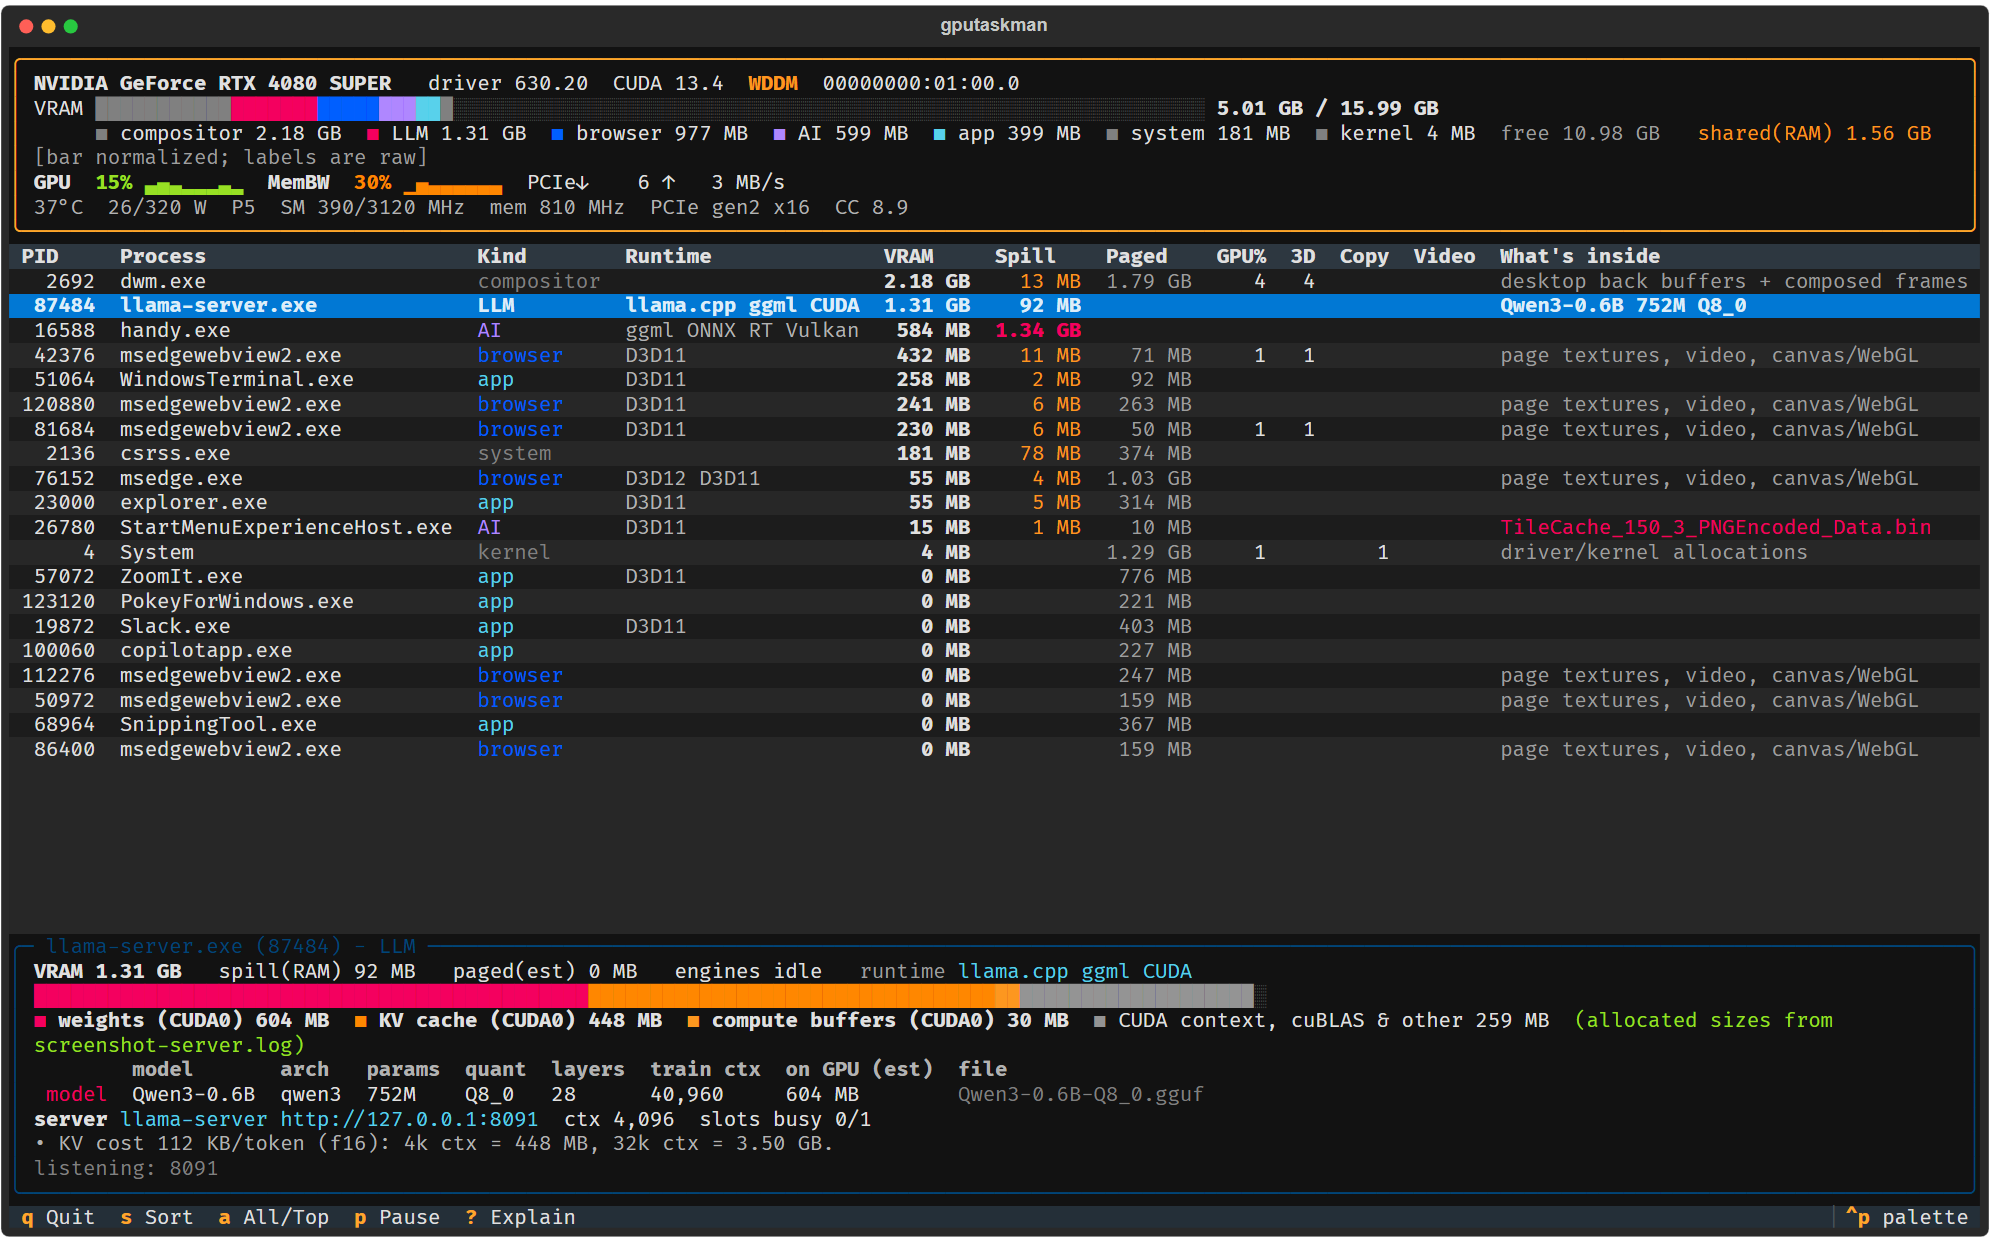
Read the evidence label before quoting a breakdown. A process counter can measure an allocation. A model-file-based estimate cannot tell you exactly what occupies each byte. Runtime logs can provide more detail when available. In XDA’s hands-on account, the writer also reported unavailable readings on a Radeon RX 9070 XT. That is a useful reason to check what your own driver exposes before comparing machines.
What if the process list is empty?
Run the snapshot command from a local Windows desktop session. If your adapter is absent or its counters are missing, run dxdiag, open the Display tab and check the driver model. The project troubleshooting notes call for a current WDDM driver and recommend checking for WDDM 2.0 or later. If only one sensor is blank while the process list and memory counters work, keep using the measurements your driver supplies.
Related Techmixer guides
- Run a local language model with AirLLM if the model still exceeds your available GPU memory.
- Compare a free cloud GPU with local hardware before spending money on an upgrade.
- Browse the Software Guides hub for more utilities.
Our take
Keep gputaskman handy when you can name the decision you need to make: which app to close, whether to shorten a model’s context, or which GPU to investigate. The most useful result from our laptop was a pair of numbers Windows users can easily confuse. Reading dedicated and shared memory together changed how we interpreted the snapshot.
Last reviewed: 20 November 2026. Techmixer checked the Windows Python package on Intel graphics. The model breakdown shown above is the maintainer’s example.
